MobileBiz Pro includes a full reporting suite covering sales trends, profitability, payments, inventory, and taxes. Here's every report available, right out of the box.
How to Get There
Open the side menu. Under Reports, tap Dashboard, Summary reports, or Saved reports — each opens directly to that tab, and you can also swipe between all three once you're there.
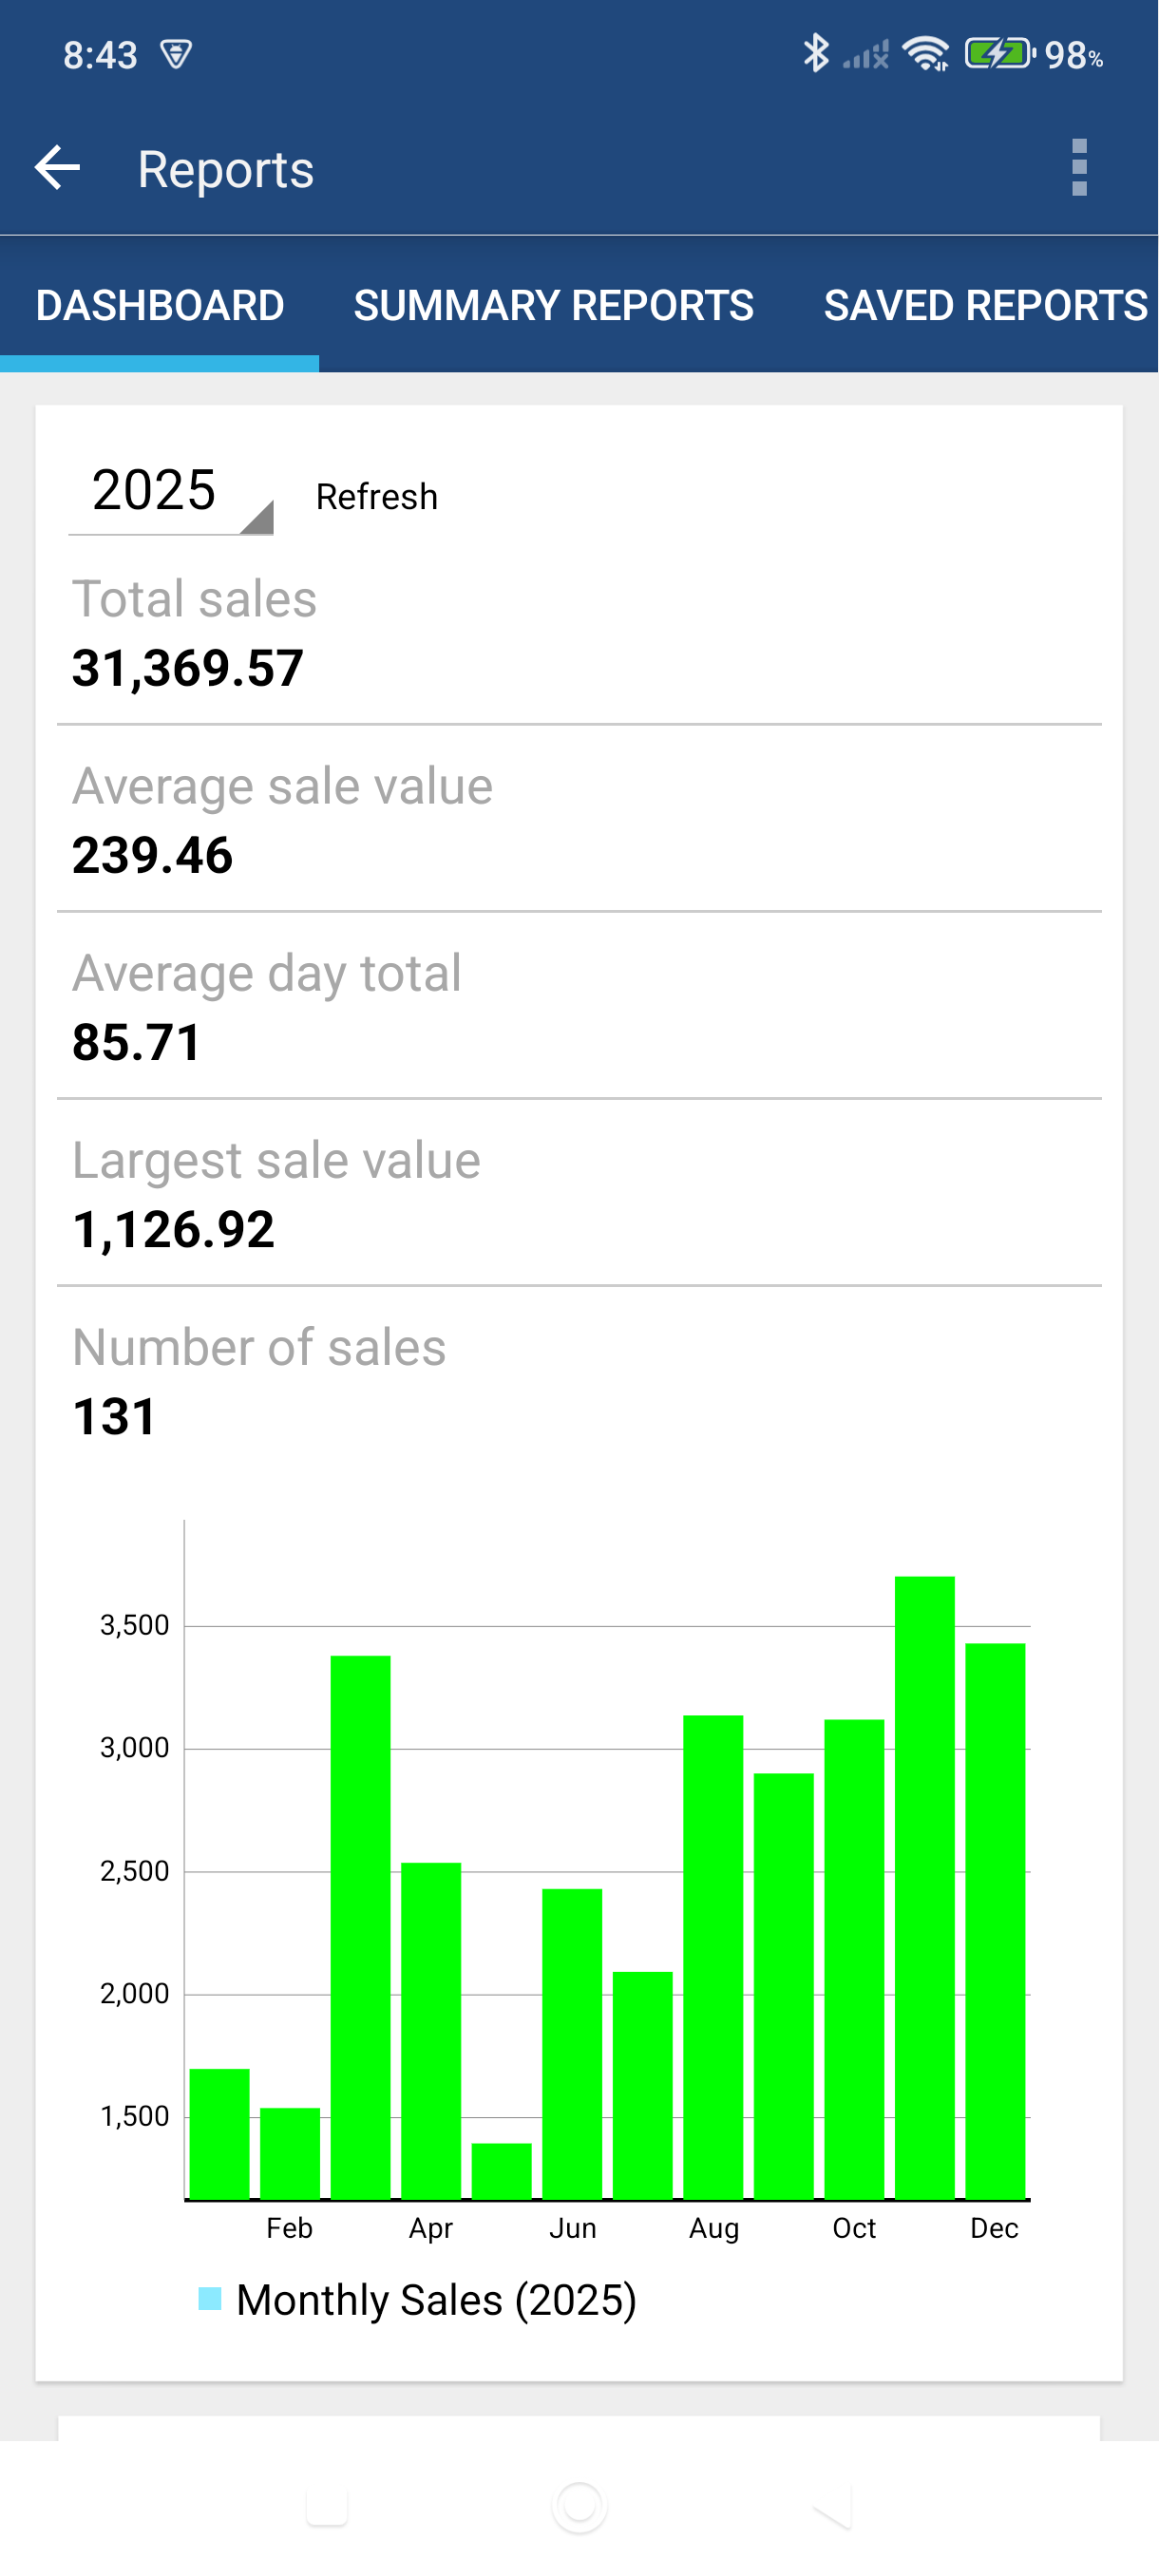
Dashboard Tab
A visual overview of your business performance for the selected year.
- Sales History Chart — Monthly or daily bar chart of your sales. Tap the chart area to drill into a detailed Sales Register or Sales By Month report.
- Quarterly Sales Breakdown — Sales totals for Q1 through Q4. Tap any quarter to drill in.
- Top Customers — Your highest-revenue customers, ranked. Tap the filter button to adjust the time period and number of customers shown.
- Top Items — Your best-selling products and services by sales volume.

Summary Reports Tab
Tap any report name to run it instantly — no setup required.
| Report | What It Shows |
|---|---|
| Sales By Month | Sales totals, transaction count, and averages for each month |
| Sales By Quarter | Sales totals grouped by quarter |
| Sales By Year | Sales totals for every year on record |
| Sales By Customer | Revenue, payments, balance, and tax per customer |
| Sales By Item | Sales performance for each product or service |
| Customer Aging | Outstanding balances aged into 0–30, 31–60, 61–90, and 90+ day buckets |
| Profit and Loss | Revenue vs. expenses (requires the Expenses @t Work companion app) |
| Income Statement | Built-in income and expense statement — no companion app needed |
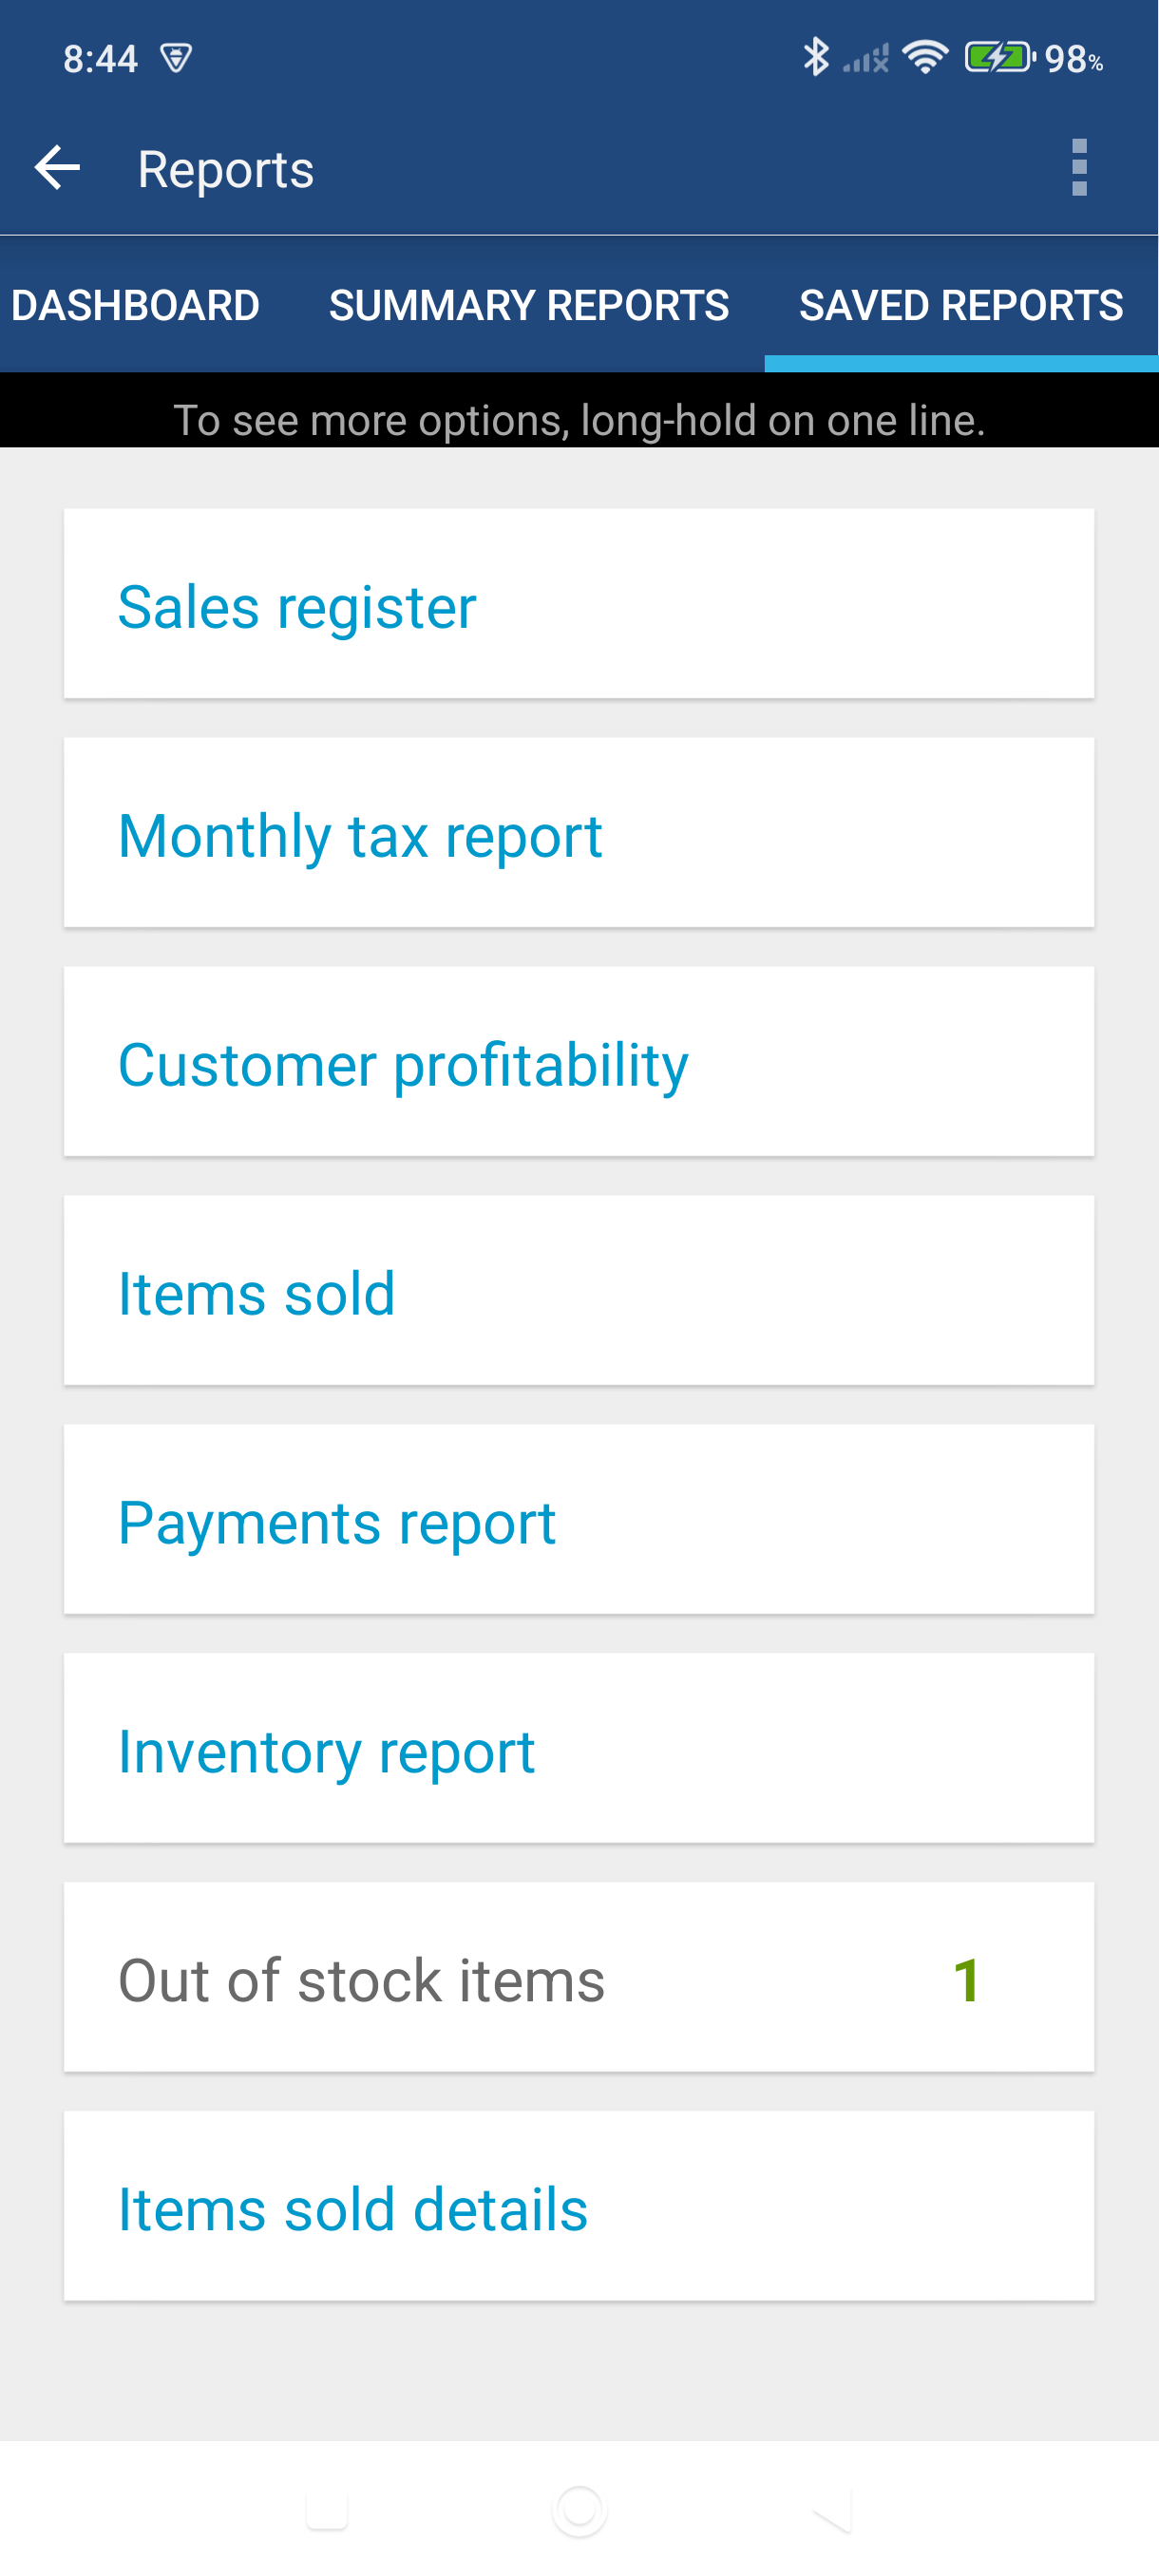
Saved Reports Tab
Advanced grid reports with custom filters, column selection, and PDF or CSV export.
| Report | What It Shows |
|---|---|
| Sales Register | Every invoice and cash sale, transaction by transaction |
| Payment Register | All payments received, with payment method and linked transaction |
| Customer Profitability | Revenue, cost, and gross profit per customer |
| Item Profitability | Sales and profit performance per product or service |
| Item Profitability Details | Line-by-line breakdown of item sales across all transactions |
| Inventory Report | Current stock levels, costs, and valuations for all items |
| Monthly Taxes | Tax collected per month, broken down by tax rate |
Good to Know
- All reports show data for the currently active company. Switch companies first if you manage more than one.
- Tap any column header to sort — tap again to reverse the direction.
- Many reports include drill-down links. Tap a customer name, sale number, or item name to jump directly to that record.
- PDF export requires an internet connection. Use CSV export when you're offline.
- The Income Statement is the built-in alternative to Profit and Loss — it doesn't require any extra apps.
- Built-in report templates (shown in blue on the Saved Reports tab) can be copied and customized, but cannot be deleted.
For instructions on filtering and saving custom reports, see How to Customize and Save Reports.
Still stuck? Contact Support for help.